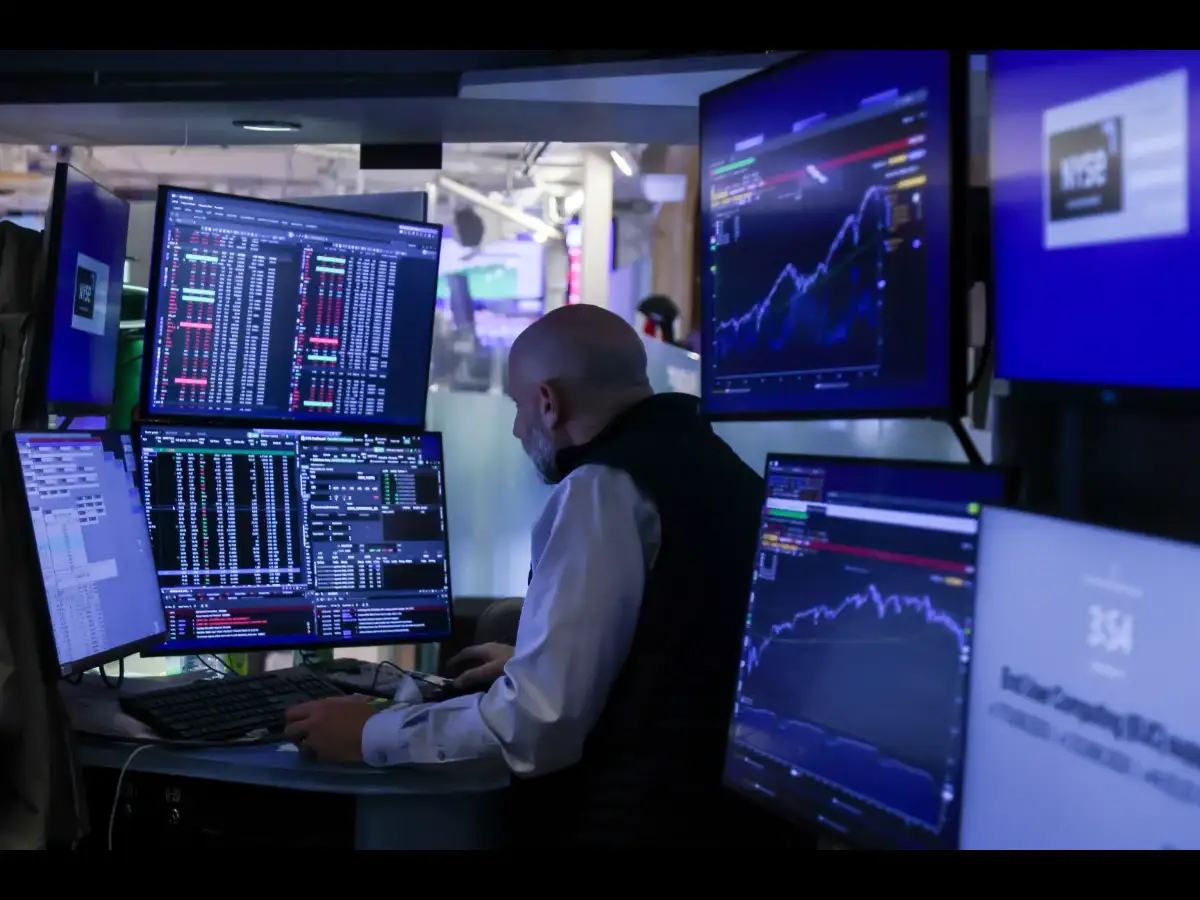

The Indian stock market saw divergence in its benchmark indices for the second consecutive session on Friday, with the Sensex closing in the red and the Nifty in the green following sharp swings during the closing auction session (CAS).
Sensex and Nifty both traded in the green before the CAS began. The indicative prices of both benchmark indices sharply tumbled, with the Sensex plunging nearly 1,000 points within a few seconds, before making a sharp recovery. While the Nifty managed to recover all losses during the CAS, the Sensex ended with marginal losses in the red despite a sharp rebound.
Analyst Sudeep Shah, Vice President and Head of Technical & Derivatives Research at SBI Securities, interacted with ETMarkets regarding the outlook for the Nifty, options data, and an index strategy for the upcoming week. The following are the edited excerpts from his chat:
1.) Sensex and Nifty were marginally lower this week. Do you expect consolidation to continue? What are the key levels to focus on?
For the sixth consecutive week, the benchmark index Nifty ended on a negative note. However, the index witnessed a minor pullback during the week and closed with a marginal loss of 0.22%. On the weekly chart, Nifty formed a bearish candle with a lower shadow, indicating buying interest at lower levels. But whether this buying interest can actually halt the ongoing correction remains the key point to watch.
Despite the recent pullback, the index continues to trade comfortably below its short- and long-term moving averages, with these averages still trending downward. The Daily RSI rebounded after testing a low of 22.23 and is currently placed at 34.17. The RSI has also witnessed a bullish crossover, suggesting that the intensity of the recent correction has moderated and a short-term pause in the downtrend could be underway. This improvement in momentum offers some relief, but the crucial support levels will decide whether the recovery can sustain.
The 23,050–23,000 zone will act as a crucial support area, as it represents the confluence of the previous swing low and the 61.8% Fibonacci retracement of the prior upward rally. A decisive break below 23,000 could signal a resumption of the downward move, potentially dragging the index towards 22,700 in the short term. Therefore, the next major clue could emerge from how Nifty behaves around the 23,000 mark.
On the upside, the 10-day EMA zone of 23,450–23,500 will remain an important hurdle. A sustained move above 23,500 could strengthen the ongoing pullback and pave the way for a move towards 23,700, followed by 23,900 in the short term. With support and resistance now clearly defined, the battle between 23,000 and 23,500 could set the tone for Nifty’s next short-term move.
2.) Where are you seeing a strong option position right now, and which Nifty strikes could act as immediate support or resistance zones going into next expiry?
For the current weekly expiry, option positioning suggests strong resistance near the 23,400 Call strike, followed by the 24,500 Call, which holds substantial open interest and may cap upside moves. On the Put side, the 23,300 strike has the highest open interest, followed by the 23,200 Put, indicating a strong support base at lower levels.
3.) Nifty IT was down almost 1%, while Bank slipped 0.5%. How are charts looking for the two?
Nifty IT Index is trading below its key moving averages. The Index faced stiff resistance around its 100-day EMA four sessions ago and has since witnessed a sharp decline. The RSI has slipped below the 40 mark, indicating bearish momentum. The immediate resistance for the Index is placed in the 29,300–29,400 zone, and the bearish bias is likely to persist as long as the Index trades below this zone.
Bank Nifty has been consolidating within the 56,996–55,699 range for the last seven trading sessions. Despite the consolidation, the Index continues to trade below its key moving averages. The ADX has started to rise, indicating bearish trend strength. As long as the Index trades below the 200-day EMA zone of 56,700–56,800, the trend is likely to remain sideways to bearish.
4.) How should investors trade Tata Chemicals, Tata Investment Corp, TCS, and Tata Motors PV?
Tata Chemicals witnessed a strong pullback over the last two days. The RSI has risen sharply, reflecting the strong momentum during this period. However, the stock faced resistance around its 100-week EMA zone of Rs 805–810. Only a decisive breakout above this zone could pave the way for an extension of the pullback in the near term. Until then, the bearish bias is likely to persist.
TCS remains in a downtrend and continues to trade below key moving averages. The RSI is in a falling mode and has slipped below the 40 mark, indicating bearish momentum. The MACD line is also below the zero line, signalling a weak bias. The 20-week EMA zone of Rs 2,310–2,320 is likely to act as resistance, and the bearish bias is likely to persist as long as the stock trades below this zone.
Tata Motors PV remains in a downtrend and continues to trade below key short- and long-term moving averages. The MACD line is well below the zero line, reflecting a bearish bias. The RSI is also below the 40 mark on the weekly chart, further reinforcing the bearish momentum. The Rs 320–325 zone is likely to act as immediate resistance, and the bearish bias is likely to persist as long as the stock trades below this zone.
Tata Investment Corp has been moving in a Rs 762-616 range since late April this year. The RSI remained flat during this period, reflecting sideways bias. On the other hand, the ADX also remained flat, indicating lack of volatility in the stock. MACD line continues to remain below the zero line on the weekly chart, indicating weak bias. A decisive breakout on either side of the range will provide future directional cues.
5.) Can you pick 5 stocks that look good on the charts for the coming week?
Technically, Sona Blw Precision Forgings, Eternal, Lumax Auto Technologies, Eicher Motors, and Indian Hotels Company are looking good.
Disclaimer: This article has been written by Veer Shamra, who is not a SEBI-registered Research Analyst or an Investment Adviser. Veer Sharma and his/her ‘relative(s)’ (as defined under Section 2(77) of the Companies Act, 2013) do not hold any financial interest in the companies mentioned in this article as of the date of publication. The views/recommendations mentioned in this article, wherever applicable, are those of the respective SEBI-registered Research Analyst/brokerage and have been reproduced/reported with due attribution. They should not be construed as the views or recommendations of The Economic Times Digital or the journalist. Readers are advised to consider the original research report and make their investment decisions based on their own assessment. Brokerage disclaimers here