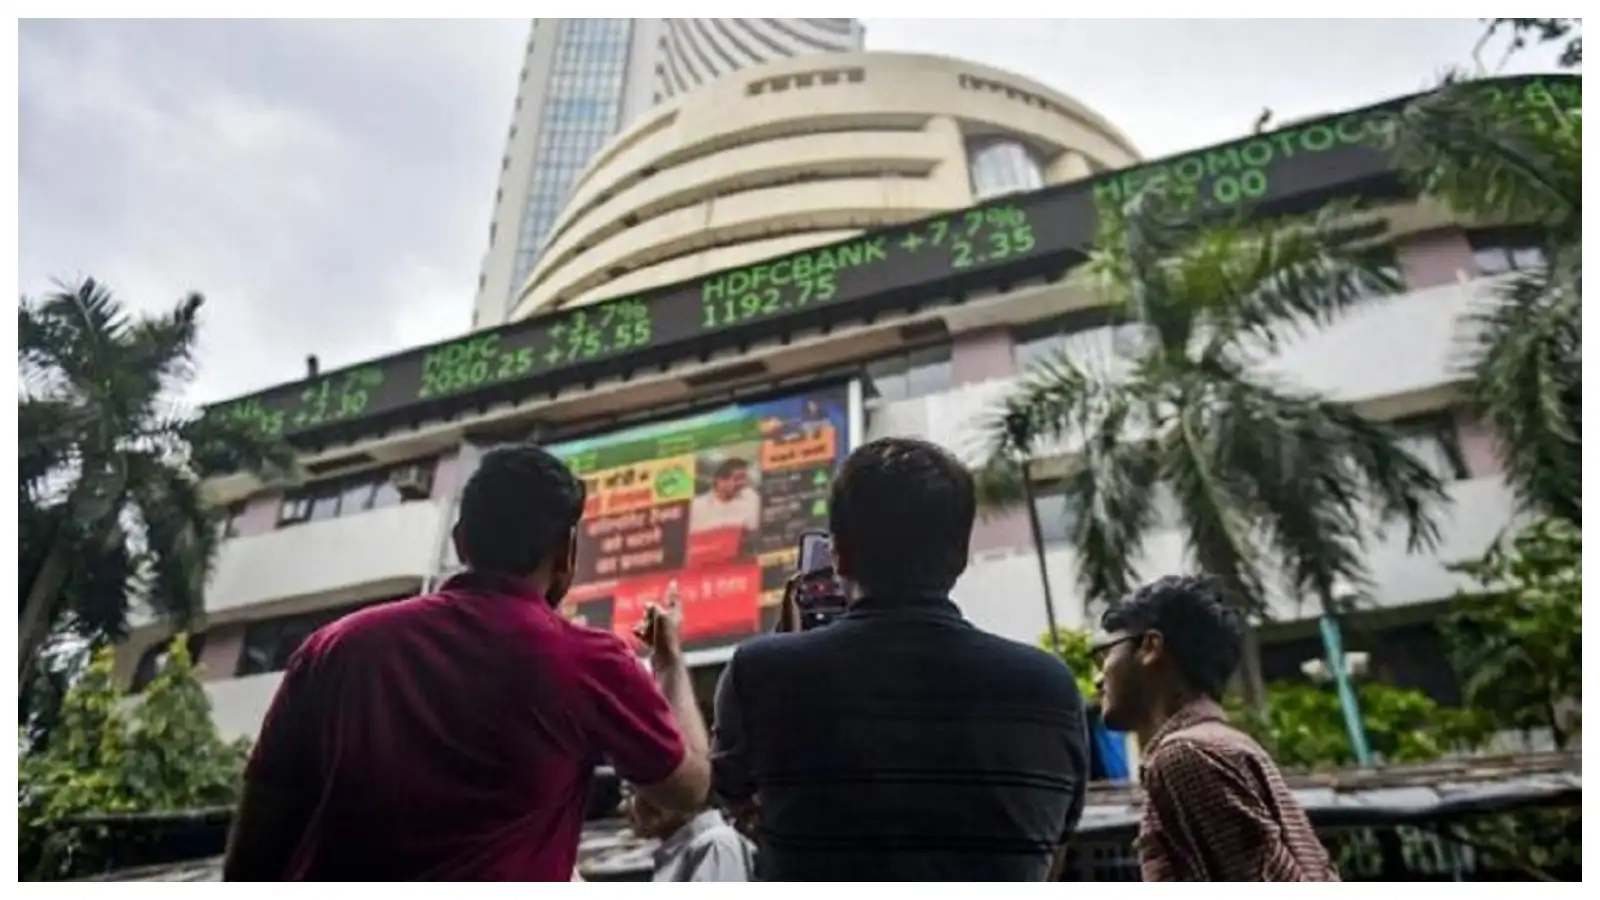


While the rich are becoming richer, they are no longer keeping all the spoils. India’s 50 largest companies, as represented by the Nifty 50, accounted for only 51% of the Nifty 500’s aggregate profit in FY26, down from 87% in FY18, as earnings growth accelerated across the broader corporate universe.
The shift is also visible in valuations as the Nifty 50 now accounts for just 40.5% of NSE-listed market capitalisation, down from 62.3% in FY14, signalling that India’s wealth creation engine is moving beyond its biggest corporate heavyweights to mid and smaller sized companies.
“The Nifty 50’s share of aggregate Nifty 500 profits fell from 87% in FY18 to 51% in FY26, while the broader universe delivered faster profit growth than the top 50. Concentration indicators tell the same story: the HHI for net sales, EBITDA and PAT all declined materially over time. The longer view therefore points to a corporate universe that is not only larger, but also deeper and less concentrated.” according to an NSE report.
The numbers point to a structural broadening of India’s equity market rather than a temporary rotation. Companies in the Nifty 500 excluding the Nifty 50 delivered a profit after tax compound annual growth rate of 16.9% between FY17 and FY26, compared with 12.5% for the 50 index heavyweights.
That divergence became particularly visible in FY26. Aggregate profit at Nifty 500 companies grew 15.4%, outpacing the Nifty 50’s 9.1% increase. In the report’s earnings contribution analysis, the Nifty 50 generated only 4.9 percentage points of the broader index’s approximately 15% profit growth.
Also Read | Nifty correction a buying opportunity, but keep 10-15% cash: Sonam Srivastava
The Nifty Next 50 contributed 4.4 percentage points, the Nifty Midcap 150 added 4.5 points and the Nifty Smallcap 250 contributed another 1.4 points. Together, companies outside the Nifty 50 generated roughly two-thirds of the incremental profit growth.
The erosion of large-cap dominance extends beyond net profit. The Nifty 50’s share of Nifty 500 revenue declined to 46% in FY26 after peaking at 57% in FY20. Its contribution to aggregate operating earnings also fell to 49.6%, compared with a peak of 58% in FY00.
The widening earnings pool has coincided with a significant expansion in the listed universe. The number of entities listed on the NSE increased from 422 in FY96 to 3,005 by June 2026, giving investors access to a much larger set of companies across sectors and market-cap segments.
Corporate India itself has become considerably larger and more profitable. Between FY03 and FY26, aggregate sales of Nifty 500 companies increased 21-fold, while profit expanded 31-fold. The aggregate profit margin improved from 6% in FY00 to a record 10.9% in FY26.
Also Read |India Inc is returning to banks for money, but retail borrowers aren’t keeping pace
Which sectors are dominating the profit pool?
The sectoral composition of those profits has also changed. Financial companies accounted for 38.5% of Nifty 500 profit in FY26, up from 24.9% in FY00. Financials’ share of index constituents rose from 8% to 20% over the same period, while their contribution to market capitalisation increased from 7% to 26%.
Financials overtook Energy as the largest contributor to Nifty 500 revenue in FY25, ending more than two decades of Energy’s leadership. The shift reflects the growing weight of financial intermediation and domestic demand within the listed corporate sector.
IT has moved in the opposite direction as the sector’s share of Nifty 500 profit declined from a peak of 17% in FY20 to 8.5% in FY26. Even so, IT profit grew 13.9% in FY26 and its profit margin remained robust at 13.9%.
Energy was the biggest driver of incremental Nifty 500 earnings during FY26, contributing 5.3 percentage points to overall profit growth, followed by Financials at 4.1 points and Materials at 2.5 points. IT contributed 1.3 percentage points.
Concentration indicators further underscore the widening earnings base. The Herfindahl-Hirschman Index for Nifty 500 profit declined from 225 in FY00 to 80 in FY26. The corresponding concentration measure for revenue fell from 185 to a record low of 88, while operating-profit concentration dropped from 46 to 20.
The broadening, however, remains uneven across sectors. Communication Services continued to be the most concentrated segment in FY26, with its four largest companies accounting for 87.2% of sectoral sales. Financials, Health Care, Materials and Industrials had considerably more diversified revenue pools.
Stock market performance has started reflecting the shift. Over the five years through June 2026, the Nifty Midcap 150 and Nifty Smallcap 250 delivered annualised returns of 17.5% and 16%, respectively, compared with 8.7% for the Nifty 50.
The divergence widened during 2026. While the market capitalisation of Nifty 50 companies was down 7.6% for the year through June, mid-cap, small-cap and micro-cap companies recorded increases of 10.7%, 14.3% and 19.5%, respectively.
The overall concentration of market capitalisation across NSE-listed companies consequently dropped to a multi-year low. The market-wide HHI fell to 67 in June 2026, compared with 173 in March 2020, when pandemic-related uncertainty had triggered a flight towards the largest companies.
For investors, the data challenge the assumption that India’s earnings story can be captured through the Nifty 50 alone. With almost half of Nifty 500 profits now generated outside the benchmark, portfolios concentrated entirely in mega-caps risk missing the market’s broadening earnings cycle.
Trideep Bhattacharya, chief investment officer at Edelweiss Mutual Fund, said some mid-cap companies are emerging as challengers to incumbent business models that dominate the large-cap universe. Changing consumption patterns could result in structural market-share losses for some established companies, with smaller listed and unlisted businesses emerging as beneficiaries, he said.
“That’s why we’ve favoured a flexi-cap strategy over a large-cap strategy—some large-cap business models are seeing structural market-share losses, which can be complemented by mid- and small-cap stocks that make up a good portfolio from a wealth-creation standpoint,” Bhattacharya said.
“For the last couple of years, we’ve suggested flexi cap over large cap for that exact reason—and now even more so.”